Financial Impact
What Impact Does Your Sales Process Have on Your Financial Statements?
By Michael J Webb
Introduction
Most companies want to improve their sales results. Like any other productive work, marketing and sales adds value, and that value can be measured. In a manufacturing plant the product is tangible and the value added is visible in the form of inventory. Managers clearly understand the impact of changes in productivity and inventory levels on their financial statements.
This is not the case in marketing and sales. First, the value added in sales is in someone’s head. This doesn’t mean that the value is just a matter of opinion. But it does mean that different techniques must be used to identify and measure it. Second, most people have only a rudimentary understanding of the relationship between the cost of sales activities and a company’s revenue. Essentially, they see sales as responsible for the “top line” and production as responsible for “the bottom line.”
In fact, marketing and sales has far more impact on the bottom line than most managers realize. But heightening this impact in a positive way calls for control and predictability that are missing in most companies. That’s because most companies fail to employ a process approach to understanding their marketing and sales activities.
This paper defines the basic approach for defining, measuring, and improving marketing and sales processes, and uses a case study to illustrate how the activities and results of the sales process impact a company’s financial statements.
The “Sales Process” and its Problems
Talk to a sales training company, and they’ll tell you they provide a sales process. Talk to a CRM (customer relationship management) company, and they’ll say they can support anyone’s sales process. Most people define the sales process as “what salespeople do.” However, there’s much more to it than that.
Companies often try to improve sales performance by training their salespeople (in selling skills or in the individual sales process, the sequence of objectives, and tasks involved in successful selling). But such training addresses only part of the problem.
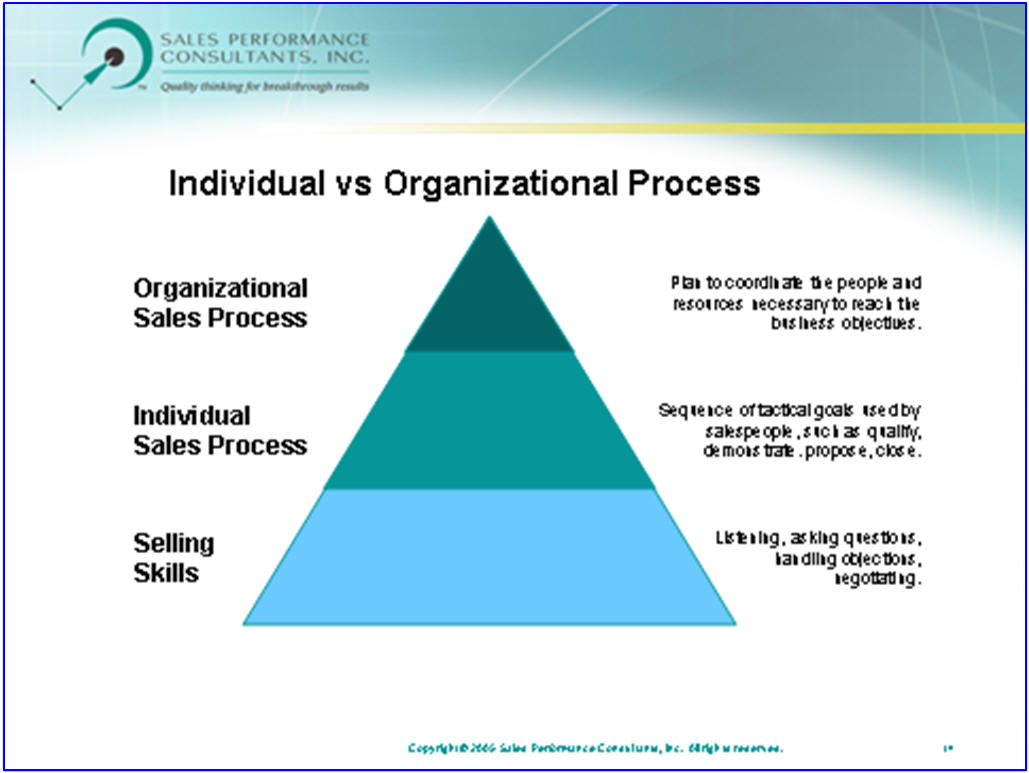
Figure 1 Personal vs. Organizational Sales Process
If the marketing strategy—including the five Ps (product, price, positioning, place, and packaging)—is incorrect, the sales process probably will be too. Likewise, if the sales process is not synchronized with the marketing process (i.e., good follow-up system for leads; salespeople understand product, pricing, and the other Ps—and why the company has chosen its configuration of said Ps—etc.), the sales process is not going to work.
To top it off, if either the marketing or sales process is bent, you’ve placed your salespeople at a colossal disadvantage (vis-à-vis the competition and your goals). You are, literally, wasting their time, energy, and skills. All of this waste costs money, particularly in forgone revenue, as will be illustrated in the next few pages.
Many executives fail to think through their organizational sales process. This organizational sales process is, in effect, “How we plan to organize and manage the resources needed to find, gain, and keep customers,” that is, our predictable, repeatable processes for:
- Finding the right quantity of qualified prospects
- Converting those prospects into paying customers
- Converting our commitments to those customers into profitable relationships
Failure to consider the organizational sales process deeply enough leaves executives facing serious, but all too common, challenges in marketing and sales:
- Conflict between Marketing and Sales
While it is easy to demonstrate that marketing, selling, and servicing are interdependent, they are often managed as unrelated activities. This can lead to costly frustration and organizational dysfunction as marketing and sales compete for resources and attention. - Lack of Coordination
Marketing departments usually work hard on branding, competitive positioning, and improved marketplace awareness. Yet the salespeople in these very same companies are often desperately seeking sales opportunities. - Poor Utilization of Sales Talent
Companies hire the best salespeople they can find, then deploy them to toil away independently, as if they were basket weavers. Each salesperson may have to invent or reinvent his or her own prospecting and selling tools, proposals, and closing techniques. Companies that competitively rank their salespeople actually discourage them from sharing best practices and helping each other! - Inflexibility
People cannot change or fix things they don’t know about or do not understand.
Here is an example of what I mean by inflexibility: A training company had improved the skills of its telesales people to help them hold more engaging conversations with prospects about their needs. However, these more effective phone calls took more time to complete. Senior management continued to insist on a high minimum number of calls per day. They assumed that success depended on quantity, rather than quality—even after investing money to improve quality. That premise ultimately invalidated much of the work—and wasted much of the money they had spent on the training.
A continued focus on raw results often blinds managers to the root of long-standing problems. Instead of identifying alternatives and systematically comparing their advantages and disadvantages, they remain stuck in their ways.
Here’s another example: I worked for a minicomputer company that had been a high flyer in the stock market in the late 1970’s. One of its key marketing strategies was having salespeople do lots of telephone prospecting. In the company’s hey-day, sales people could make 100 prospecting phone calls and find 10 or 15 prospects. A few years after I arrived, the yield was down to one prospect per two hundred calls, at best. The market had matured. Senior managers often said, “When I was in the field, I did it. I don’t understand why these people are having such a problem.” No one was measuring the performance of telephone prospecting activity over time, yet everyone had opinions about it. It was just the way we did business, and the company stuck with its “dialing for dollars” strategy. Last I heard, the company still existed but was selling only software, and revenue stood at the 1982 level.
Executives whose instincts were formed 10 or 15 years ago can have difficulty when reality changes. Instead of seeking new ways of producing, they’re apt to resort to old assumptions and cheerleading: “Make more calls!” “Push those prospects!” “Work Harder!” “Sell More!”
Measuring Sales Production Activity
Given such situations, we need an objective means of measuring activities and results over time with the goal of identifying how our business is performing and finding ways to improve that performance. The traditional focus of sales executives only on raw results does not provide the context necessary for those tasks.
In a recent article, “How to Build an Objective Management Structure for your Sales Process,” Justin Roff-Marsh, Managing Director of Ballistix, an Australian sales process engineering firm, makes an important point:
Marketing managers tell me it’s their goal to generate sales opportunities. Sales managers advise me that their goal is to generate sales. In each instance, managers forget that the processes they manage are part of a larger system. As a result, they fail to recognize that their goal must be subordinated to the goal of the system.
A fine example of a system — one with which we’re all familiar — is an internal combustion engine. As you no doubt know from your experience with this particular system, the goal of the internal combustion engine is to generate torque (rotational force).
If you were the spark plug in this system, what would be your goal?
1. Would it simply be to generate sparks (as many as possible)?
2. Or would it be to generate a set quota (of, say,10 sparks a second)?Of course, neither answer is correct. Your goal could only be expressed in terms that recognise the relationship between your activities and the goal of the system.
Accordingly, your goal would be something like the following:
“To produce a spark at the top of each compression stroke.”
Now, I ask you to make the comparison. If you are sales in the organization, what is your goal?
- To make as many sales as possible?
- To sell 10 widgets per month?
Of course not. Sales should sell when they are presented with appropriate opportunities. To be really effective, marketing and selling must be construed as a system. This implies an understanding of causes and effects, interdependencies, and how to measure the various moving parts.
A manufacturing plant secures raw material of a certain kind and adds value to it until it is ready to ship. What is the raw material of sales? Answer: people (of a certain kind) in the marketplace. The job of marketing is to attract or locate the right kind of individuals. The job of sales is to convert them into paying customers. Leads, opportunities, deals, prospects, whatever language you use, these are the “inventory” of marketing and sales—people at various stages of awareness and decision making.
Marketing and sales exists to move people through the stages of the sales process as effectively and efficiently as possible. The concept of the sales funnel, or pipeline, has been used for decades to analyze sales production. But the sales funnel usually lacks the rigor of precisely defining the meaning of each stage of the sales process.
A systems approach acknowledges the power of coordinating the resources required to find, gain, and keep customers. To design an effective sales process, we must answer such questions as:
- Where are we most likely to find people who need our products and services?
- What, precisely, is a qualified prospect?
- How can we find or generate qualified prospects in a consistent and repeatable way?
- What do we need to understand about their business to make a persuasive argument?
- How can we convert qualified prospects into paying customers consistently and repeatably?
The answer to these and many other questions enables you to design and build a sales process that works. Equally important, it enables you to define the behaviors indicating that a “change of state” has taken place. For example, if we do something that causes people to opt in to a mailing list, or come to our offices for a demonstration, their action indicates that some value has been “added.” The prospects are doing something that they presumably would not otherwise have done. These behaviors can be measured.
The traditional objection to a process approach to sales is, “It will never work because you can’t control the customer.” The idea that you can’t control the customer is the crux of the issue, because it is true.
However, this fact is the underpinning for the first principle in designing marketing and sales processes:
- Everything you do to find, gain, and keep customers must create value for them.
If your sales process actually creates value for customers, customers will be more likely to follow it. If customers follow it, salespeople will follow it. This is the best defense against changing markets, competition, and technologies. Moreover, once this flow of added value and behaviors is identified and established, it can be measured. In the next section we’ll consider an example of a company’s sales process and relevant measurements.
Sales Process Measurement Example
This example is real but includes characteristics from several companies I have worked with, and minor changes to details for simplicity.
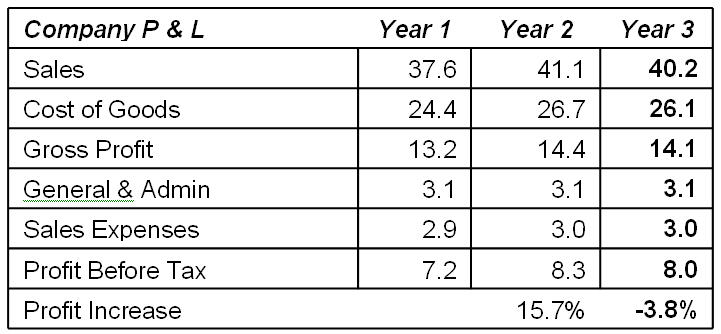
The company, a small distributor of mixing equipment, had sales of $37.6 million in year 1. Sales expenses ran $2.9 million, and profitability was respectable, at $7.2 million, or about 19% profit before tax (PBT). The company employs about 24 people in the marketing and sales department.
The sales and marketing executive was new to his position, and originally called me to request an assessment of his salespeople.
He said, “I think we might have the wrong kind of salespeople in our company. “They’re finding deals for one or two machines, but we need deals for one or two hundred machines.”
I asked him how they were spending their time.
“Well, the company has some challenges. Our pricing is tricky. For some reason, 90% of our customers seem to order nonstandard products. We have miscommunication around invoices and too many customer service problems. Customers say we’re hard to do business with.”
I asked him why a large customer would want to do business with his company.
“Well, we do have a value proposition. But it’s hard to focus on that with all this other stuff going on.”
Indeed. With that “other stuff going on,” how could any salesperson excel?
We reviewed his situation in depth. The first year of our analysis had not been bad, but competitors seemed to be growing faster. The sales executive began trying to figure out how to improve results. His salespeople had deals on the fire, but not much new business was closing. This led him to believe that his people didn’t know how to close. He had seen it before: salespeople were too quick to quote prices and too slow in getting firm commitments. They seemed to be weak on follow-up, and perhaps not aggressive enough.
The sales executive decided to hire a sales training company to improve his people’s sales skills.
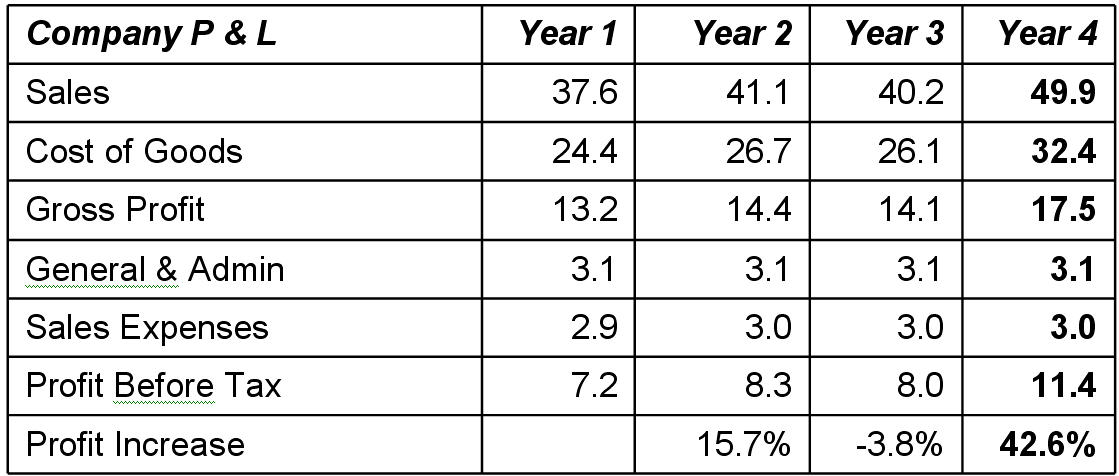
The result? It was good sales training. There was field coaching, and they did sell more in year 2—$3.5 million dollars more– for a 9.3% growth rate. But because of the training costs, sales expenses were up $100k as well. Overall, the results of $8.3 million in profit were not too bad and even represented a 1% increase in profit margin.
How much of the improvement was due to the sales training? How much was due to an overall improvement in market conditions? It’s hard to say. But now, how could he further improve results? He just finished running the sales force ragged with the additional work of the training engagement. He also has an additional year of experience, with a better understanding of how few and far between the big deals really are and how hard salespeople have to work to find them.
This executive was a marketing VP in his previous job, and, despite the differences in the industry and the market, he believed a new marketing campaign could make a difference.
“We aren’t presenting ourselves to the market properly,” he said. “We need a new image and promotional effort to convey the value we really offer!”
He brought in a marketing organization to develop a new branding and promotional strategy. The company pumped money into the new campaign, and initially it seemed to work. Everybody loved the new logo, and the new look of things, and the marketing outfit sent the salespeople thousands of leads to work on. Sounds great, right?
Unfortunately the numbers were not good. He had made sure his salespeople used all those selling skills, and he saw the long lists of leads himself. Yet mysteriously, revenue declined! Sales expenses stayed the same, because the marketing expense essentially replaced the sales training expense.
Year 3 was a frustrating one, with PBT down from $8.3 million to $8.0 million. On balance, the new branding and promotional strategy did not work.
What should this company do? Here are the things that had been under consideration:
- Find different salespeople?
- Conduct more sales training ?
- Try a different marketing campaign?
- Install CRM Software?
- Hire a new VP of Sales and Marketing?
- Spend more time on forecasts?
- Adjust the compensation plan?
- Launch a sales contest?
Given the existing measurements (i.e., revenue and cost information only), there was really no way to determine what kind of corrective action was required. Let’s go deeper and see what’s happening underneath.
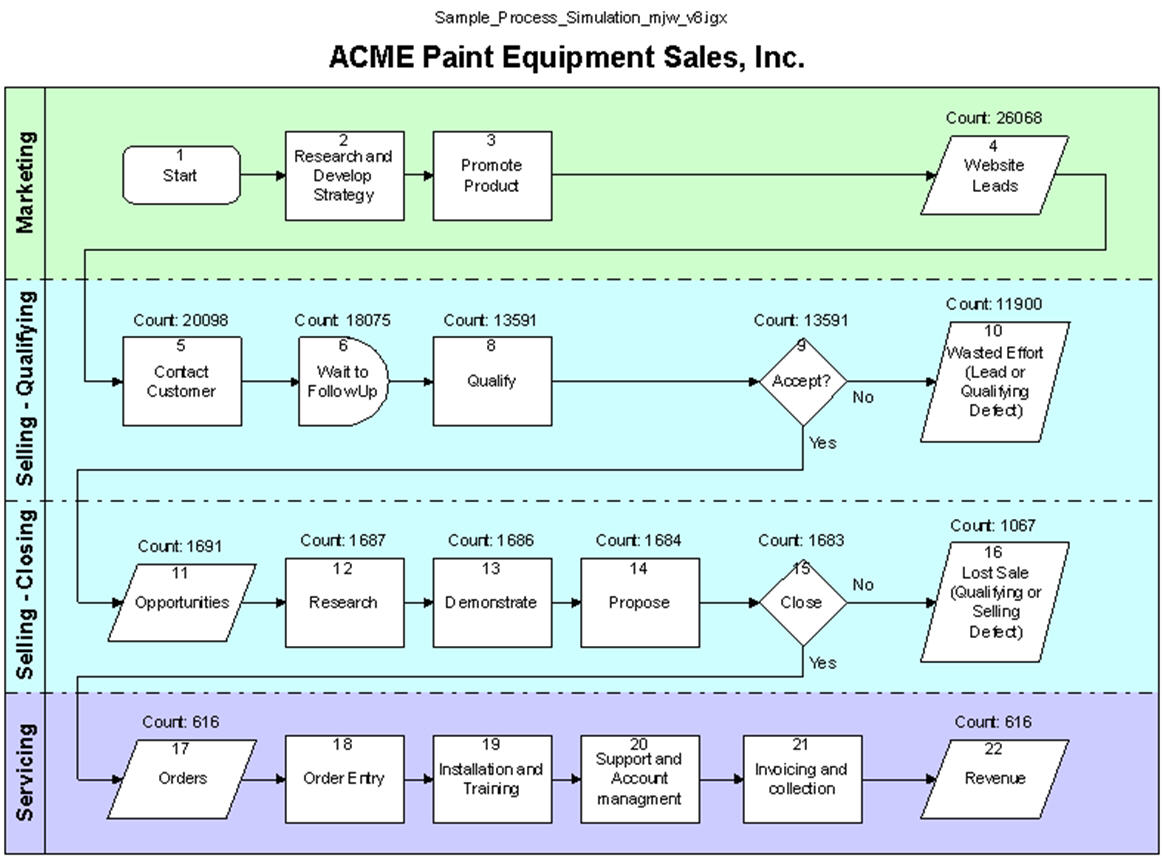
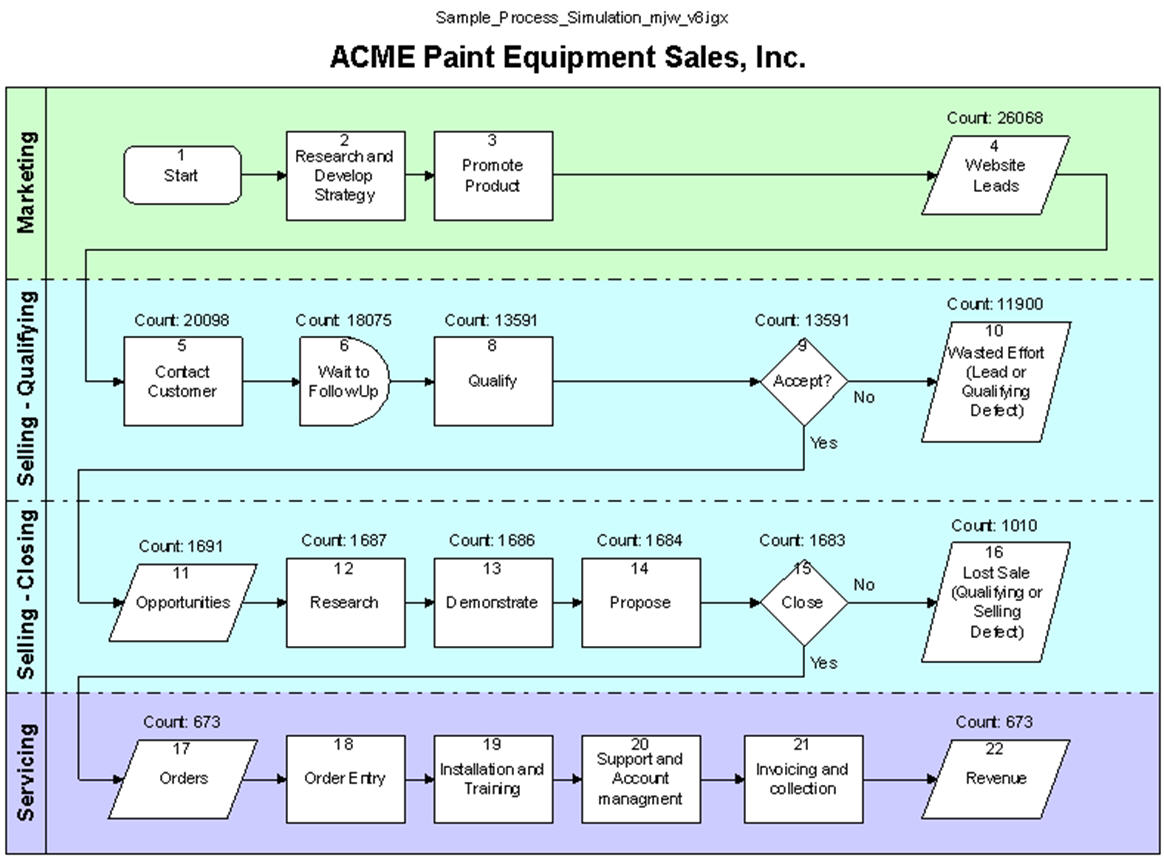
To do that, I’ve prepared a simulation of the sales process for this company using iGrafx software (www.igrafx.com). Here is the process map:
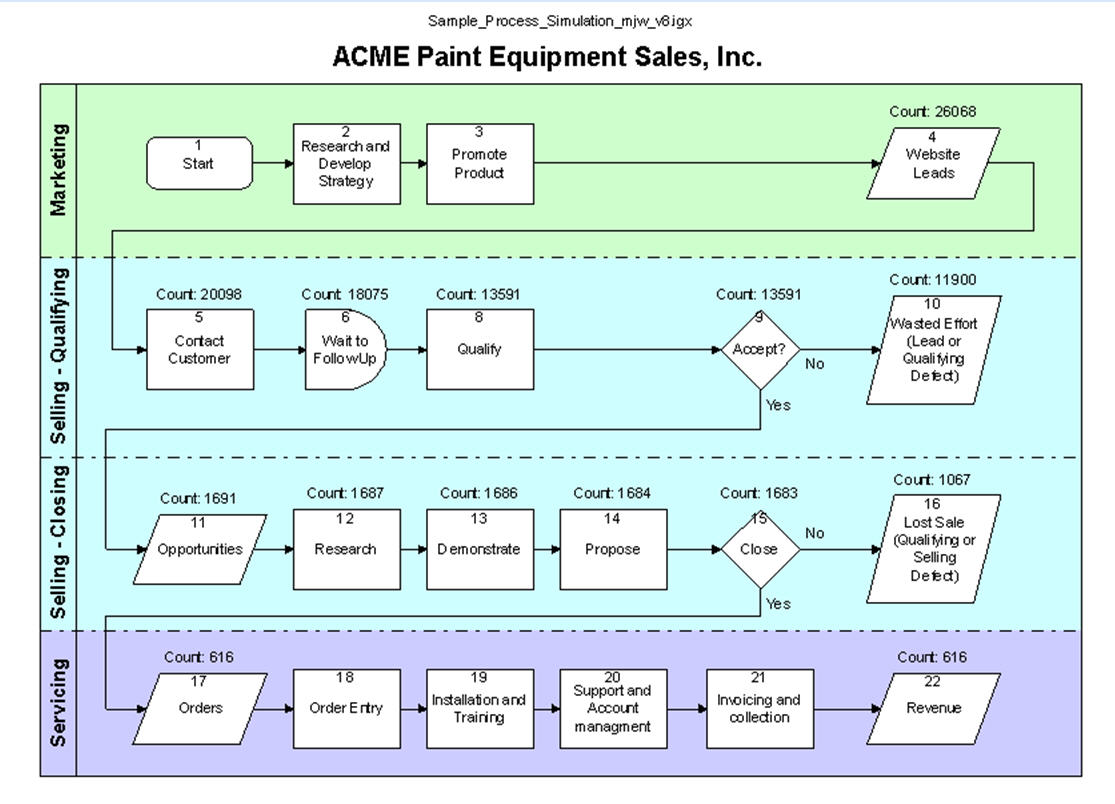
Figure 2: Baseline (Year 1)
This company’s marketing process generates leads through promotion and a website. The sales department contacts those leads, follows up through the typical delays in making contact, and ultimately qualifies them. Qualifying is a go/no-go decision. If they don’t find a live sales opportunity then and there, it becomes, in effect, wasted effort.
If they do find an opportunity, they research the deal, conduct a demonstration, prepare a proposal, and try to close the order. If they lose the sale, again, it becomes wasted effort, called lost sales. If they win, it becomes an order and goes to the service department. In this example, we have the same people doing the sales qualifying activity as doing the closing activity.
Here are some characteristics of this company’s selling processes:
- Contact and follow-up requires about 15 minutes per lead, and a percent of leads require a follow-up call up to two months later.
- Once the lead is qualified, it takes salespeople from 2 to 8 hours to research it, from 4 to 16 hours to conduct the demonstration, and from 2 to 8 hours to prepare a proposal. These variations are distributed normally across the transactions.
This simulation software gives us the transaction counts at each stage of the process (as shown in the diagram). From these counts, we can calculate the number of hours required at each stage, which enables us to determine the actual throughput and the costs of these activities. We can see what is really happening. Instead of relying on the “gut feel” of our sales executive, we have actual data to analyze.
The process map illustrates how many transactions have made it through each step at the end of Year 1. It processes all those “transactions” according to the rules we establish for the behavior of the process. Among those rules are the “yield.” In this process, 12% of leads yield opportunities, and 38% of opportunities yield orders. However, because of the processing time required and limited number of employees, throughput is somewhat less.

Only 6.5% of the leads in the first year ultimately make it through to become opportunities (1691 opportunities/26068 leads = 6.5%). Only 36.4% of the opportunities ultimately make it through to become orders (616/1691 = 36.4%). The remainder of the leads and opportunities are still waiting to be followed up on, or are “work in process.” (This illustrates the need for simulation software over spreadsheets, since simulations are designed to process transactions.)
Let’s depart from marketing and sales language and talk in quality terms for a moment (specifically, Six Sigma terminology); Since unsold leads or missed opportunities should be counted as defects (in Six Sigma language), our process produced 25,452 defects (26,068 leads – 616 orders = 25452)!
A simple calculation reveals that our process creates 976,369 defects per million. Consider this: A process operating at a Six Sigma level creates only 3.4 defects per million. A process that creates 50% defects is operating at 0 sigma. Therefore, our particular sales process resides deeply in the negative sigma range. This is absolutely typical of sales organizations.
Now, consider the quantities of leads, opportunities, and orders during a 3-year span:

Remember, in the second year the organization tried sales training, and in the third year they launched a marketing campaign. While the latter generated a lot more leads, the expected increase in the number of sales opportunities did not materialize!
Like many marketing departments, the one in this company assumes that any lead is a good lead. To them, everything looks like a lead, and heaping them onto the sales department is their job. They appear unaware of the fact that the sales department can’t seem to “handle” any more.
As we asked about how they market, we learned that, like most companies, their website is built around their product. Every visitor to the website who downloads or requests anything from the website is unwittingly raining so-called “leads” on the sales department. In reality, they are merely providing contact information. When visitors are asked to provide their contact information, they often fear the worst: A salesperson might call them up and pressure them to buy. To protect themselves, those visitors provide as little contact information as possible. In fact, Mickey Mouse and Richard Nixon are repeatedly visiting the site and downloading things.
Even though selling tasks were given higher priority than qualifying, the leads came in so fast that it diverted resources away from selling. Adding more leads actually made matters worse.
The real problem is that salespeople can’t sell leads. They can only sell opportunities. They must invest time and energy to see if a given lead might be an opportunity. And that–the impossibility of qualifying all of those “leads”—is creating the bottleneck in the sales funnel.
This is why, from the second year, when there were over 26,000 leads, to the third year, when the number of leads doubled to over 52,000, the number of sales opportunities decreased!
However, remember that 38% of opportunities turn into orders. That’s not a bad close ratio. Given this, does the company’s sales process really require major surgery? If so, what part of the process needs the work? And what, indeed, can be done?
To answer those questions, we must take one more step. We have analyzed the activities and counted production, but we have not yet translated the impact into terms recognizable to everyone in the organization: How much is all this costing? How can we know for sure where in the process we should invest time and energy required for an improvement initiative?
Translating the Languages of Business (or: Converting Quality to Currency)
To get to the bottom of things in this company, I have employed a technique that was pioneered by Jon Theuerkauf of HSBC Bank and Ralph Jeswald, partner in a CPA firm in Buffalo New York (see appendix for further information). Their project in the brokerage division of HSBC won first prize at the IQPC’s Six Sigma Summit project competition in Miami in January 2004.
Essentially, Theuerkauf and Jeswald showed their divisional vice president how much each lead and opportunity was costing the company. This enabled them to reveal the bottlenecks in the department’s operations that had gone unidentified. They documented things in a way that focused people’s minds on business realities, and even satisfied the company’s financial controller. This is how they did it:
The amount of money spent on sales and marketing is known because it is accounted for in the general ledger in the wages, expenses of sales and marketing people, use of technology, and travel. The question is, can we somehow use the process map to allocate those costs? The answer is, yes.
Once the process map is defined, you can ask people what percent of their time is spent on the various stages of the process. This information, plus transaction counts, gives you the connections you need to convert the general ledger amounts to specific costs associated with the process and, more importantly, to the “cost drivers” (the accounting term used to define that which consumes costs).
Cost drivers are those things that consume resources in a production process. Items in production on the plant floor–work-in-progress and finished goods—consume materials and labor. So do leads, opportunities, proposals, and orders in a sales process. Therefore, the costs per lead, per opportunity, and per order are truly valuable information. Yet these costs will be wildly inaccurate if you try to calculate them without knowing how the work is actually being done. An process map is required.
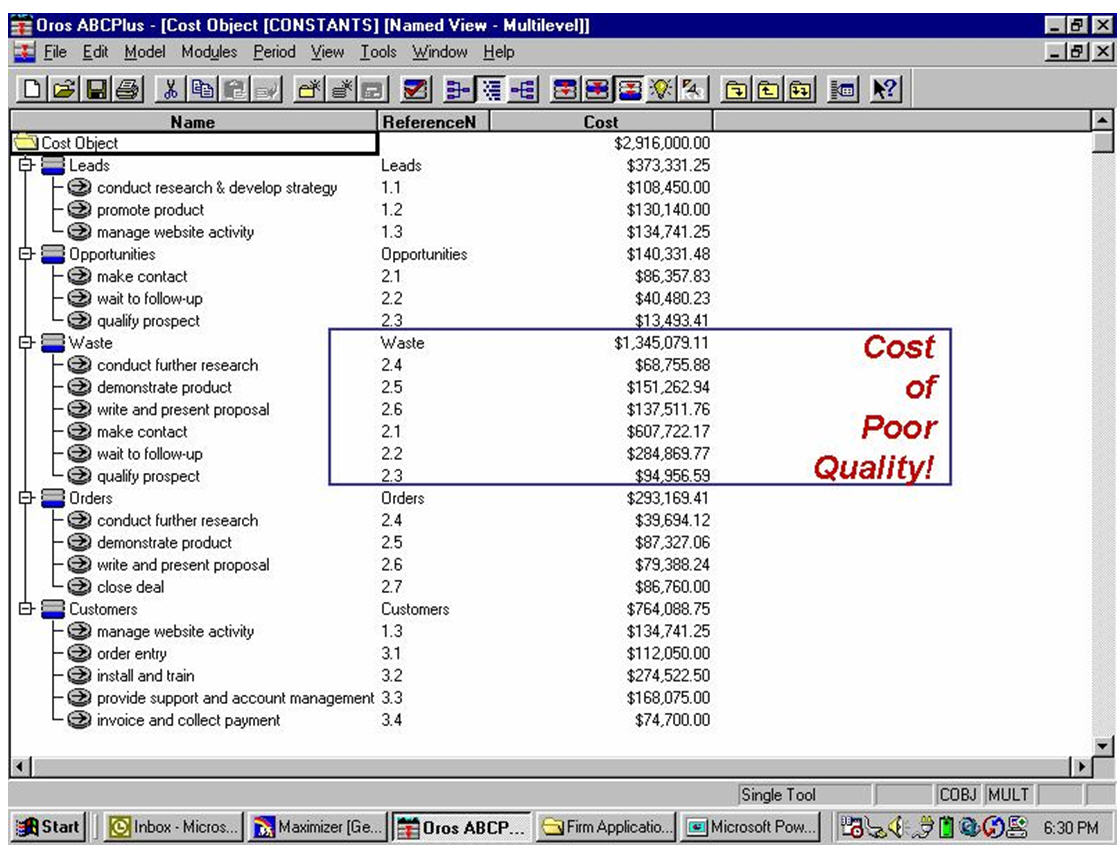
The diagram in “Figure 3: Baseline Cost Object Model (Year 1)” (from an activity-based cost-accounting program) illustrates how this works. We had $2.9M in general ledger costs (wages, expenses, technology, and travel). Using the process map, and the estimates of employees’ time required for each step, the costing software can then calculate the cost of leads, opportunities, and proposals. More importantly, it can also calculate the costs of leads that don’t turn into opportunities, and opportunities that don’t turn into orders.
Six Sigma folks will recognize this immediately as costs of poor quality.
The analysis shows that a whopping $1.345 million–almost half of all marketing and sales expenses–went to waste! Moreover, by far the largest portion of this waste was driven by salespeople’s efforts to contact all those “leads” ($607k). Each so-called “lead” that didn’t turn into an opportunity was costing $51 ($607,722.17 / 11,900 = $51), and this calculation does not consider opportunity costs (i.e. potential profit from this time if it had been spent more productively). Clearly, finding some way to improve the yield of qualifying leads will provide the highest return.
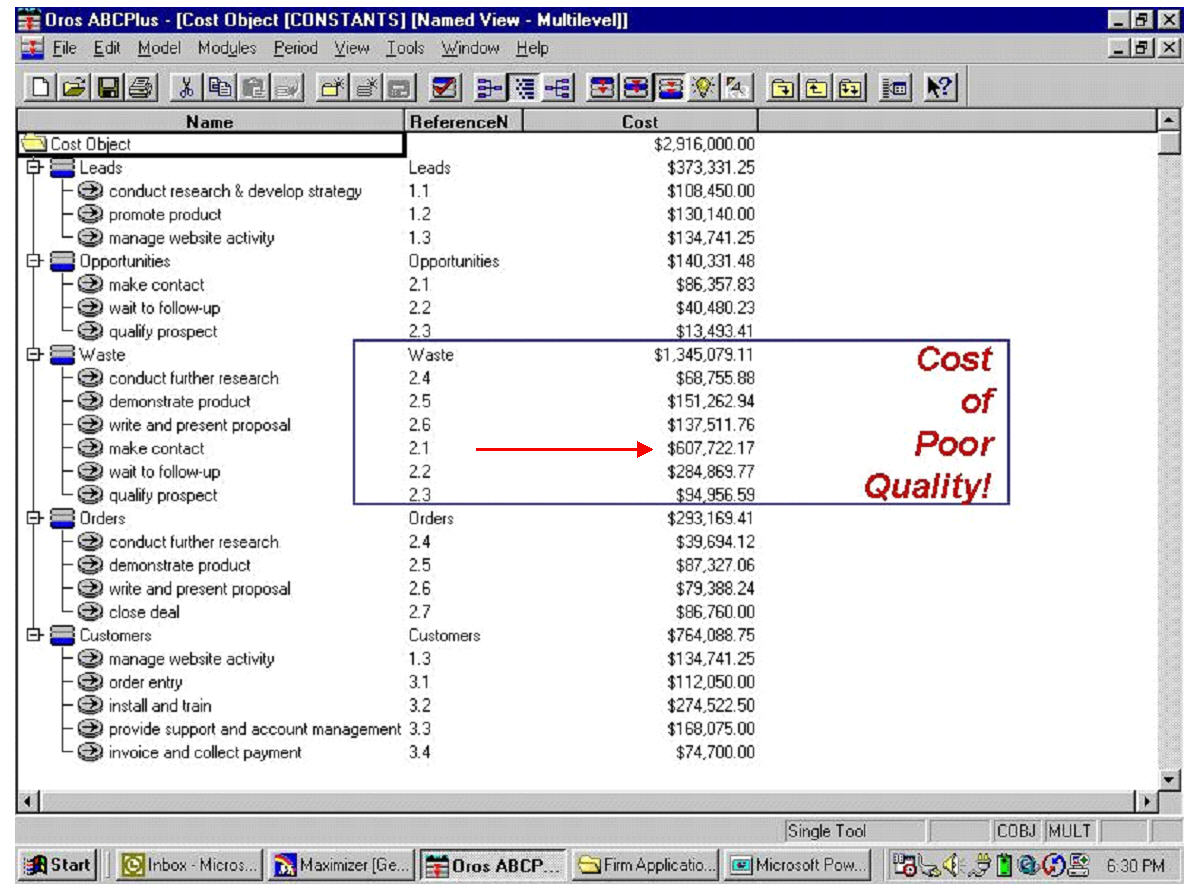
Figure 3: Baseline Cost Object Model (Year 1)
This is a great way to leverage the understanding of the process you get from process mapping, and to translate that understanding into dollars. Sometimes a process approach strikes people as academic and unrelated to the real world. With this dollar-based approach, we connect directly to the financial reporting system in a credible way. You will get their attention!
Now we’re prepared to focus on a project to improve a very specific kind of defect: leads that don’t qualify as opportunities. The costing analysis indicates that this is the best place to invest time and energy. That analysis also gives us a way of measuring the impact of any changes we make on the overall system, which is a powerful capability.
Improving the Process and Demonstrating the Results
How can we help the marketing department generate more opportunities and less waste? Put another way, how can we help marketing increase the quality of its leads?
Here is an approach to sales process design that can be applied in many different kinds of situations.
- Principle # 1 – Value: Everything we do to find, gain, and keep customers must create value for them.
Why are people going to our website? What are they trying to do? What problem are they trying to solve? If we can help visitors get what they want, maybe we can get the information we want from them in return. Toward this end, many companies are beginning to design their websites around the customer instead of around their products.
I helped one of my clients conduct a survey of site visitors. We discovered four basic reasons that people visited the site:
- They wanted to evaluate the products
- They wanted to learn how to use the products for free
- They had a problem or question
- They wanted to know the ROI, and how to sell it internally
A visitor who can meet any, or all, of these needs at the company’s website has gained value.
- Principle # 2 – Progression: Identify the stages of value added from the customer’s perspective.
The knowledge of what the customers wanted to do allowed us to make some important design decisions. Essentially, we could give them the four options and provide “doors” for them to go through to get what they wanted. In effect, we redesigned the website to ask people which of these things they wanted to do, thus turning it into a massive sorting system for visitors!
- Principle #3 – Purpose: The purpose of the sales operation is to move people through the stages of value.
By helping visitors get what they want, we help people move through the stages of value. There is a treasure trove of valuable information behind those doors (white papers, webinars, newsletters, demonstrations, case studies, technical notes, analytical tools, whatever would answer the question behind that particular door). Getting there requires only a valid e-mail address.
Of course, some visitors will want more: They might want to talk to a customer support rep, or ask a specific question relating to their situation, or talk to a salesperson. Moving to this inner level requires visitors to provide more detailed information to enable us to help them.
No longer do we dump unfiltered information on the sales department. In fact, the visitors to doors 2 (free training) and 3 (questions or problems) rarely involve the sales department at all. And people are far less likely to use phony names because they know the sales organization is not likely to pester them. When visitors to doors 1 and 4 are passed on to the sales department, it is with a specific reason.
Finally, we are in a position to leverage the last principle of sales process design:
- Principle # 4 – Measurement: Link the stages of value together to measure activities and results.
Website traffic is fairly easy to measure. Can you see how this would increase the quality of leads to your sales department? Would this kind of approach help your company earn the right to ask for more information from prospects?
This website strategy is just one application of the above principles. This kind of approach places the focus on the customer’s problem rather on than your product. Ideally, your value proposition should draw prospects toward you like a magnet. Success becomes an issue of artful communications. Measurement systems won’t supply the right words, but they will enable you to gauge the effect of whatever words you do use on traffic patterns and throughput.
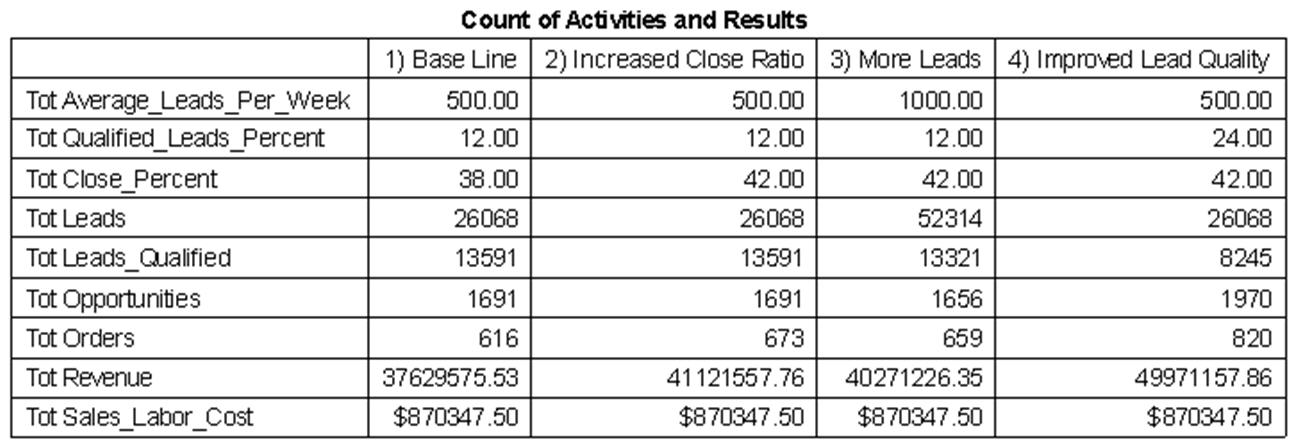
Now remember that our yield of leads to opportunities was only 12%. What do you think it could go up to with this kind of approach? Suppose the yield of leads to opportunities doubles, to 24%. What effect will this have on our system? The table below illustrates the effect of this change, as well as all the major variables we have measured in this example during a 4-year period:

Simulation software allows you to observe the behavior of the system when you change one variable at a time. Note that although there were fewer leads in Year 4, the impact on revenue and profitability is huge. We spent no more money on sales expenses, but we got a lot more for it. Revenue is up $9.7 million, more than 24%! Sales and marketing expenses stayed the same. We’re not factoring in any potential improvements in inventory turns or other operational changes, just pure performance of the sales and marketing operation.
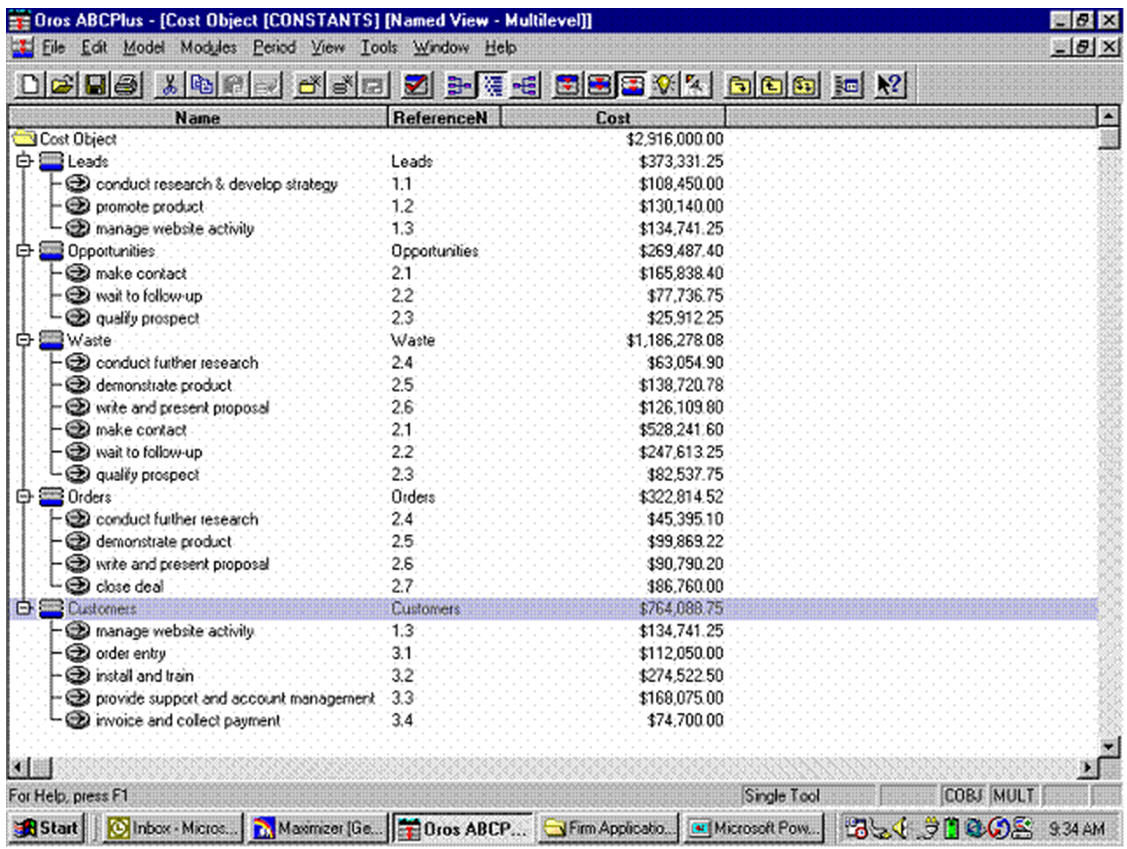
Ultimately, our cost analysis shows that we convert about $159,000 of non-value activity to value-added going from base line to final by executing our process improvement initiatives ($1,345,079 – $1,186,278 = $158,801). For one thing, a comparison of Year 2 and Year 4 shows that we generated an additional 279 opportunities from the same number of “leads.” We reduced the wasted time and resources chasing leads that didn’t convert to opportunities. (Please see the appendix for detailed counts of transactions and cost models at each stage of the process.)
Now, some people will be tempted to allow only a narrow interpretation of return on investment (ROI) on this improvement project. Such an interpretation would argue that as long as the website improvement cost is less than $159,000, it would be cost justified.
However, that argument completely misses the point! The power of what we have improved in the system is reflects a huge 24% revenue gain of $9.7 million between Year 3 and Year 4 alone. The process capability of the system has been improved. It performs in a more predictable way. This performance can be measured, and this improvement has dramatic effects on revenue and profitability.
Manufacturing organizations have known for years that reducing waste has an exponential impact on the system. And if you consider the improvements since the base line (Year 1) (that is, improvement in the close ratio as well as the opportunity ratio), we have achieved almost $12 million in additional revenue and $4.2 million in additional profit for investments that, in relative terms, are peanuts.
Conclusion
Occasionally, I have had to bite my tongue as sales executives at world class companies proudly showed me their statistical operating reports. These reports painstakingly documented their bookings in every conceivable way: by region, product, salesperson, customer, and so on. Yet these executives had no idea that their information was nearly useless in analyzing and improving their sales operation because it did not measure the activities that produced those results.
They would have scoffed if I’d told them that, compared with their counterparts in manufacturing, they were flying blind. Sales managers at all levels become so used to not seeing where their results come from that they reflexively rely on gut feel and flavor-of-the-month initiatives such as sales training and marketing fads. Often this management style feeds the conflict and lack of coordination between marketing and sales, poor utilization of sales talent, and inflexibility that are so common in sales organizations.
The sales process is among the most vital parts of an enterprise. It is also where we must spend our money as intelligently as possible. This paper has illustrated how applying rudimentary process mapping, measurement, and analytical techniques to marketing and sales generates financial returns of a significant multiple of the investment in such efforts.
The scientific approaches that have been so well proven in manufacturing production environments can be applied to marketing and sales environments. Doing so will dramatically improve your company’s ability to achieve its financial and other business objectives.
Appendix – 1
Appendix 1 – Acknowledgments
The idea for this paper came from a project implemented by Jon Theuerkauf of HSBC Bank and Ralph Jeswald, partner in the CPA firm Tronconi Segarra & Hore, in Buffalo New York.
I solicited the assistance of Ralph Jeswald and Kim Scott, a Black Belt and customer support engineer with iGrafx (www.igrafx.com), the process mapping and simulation software company, to prepare this example.
The idea was that simulating the process could demonstrate what is really going on in an organization, and make it easier to see how process oriented tools and six sigma could be used to fix them, and to make a lot more money as a result. Basically we executed four of the five steps of Six Sigma in this exercise, using information from various live client situations where ever possible:
- Define:
We created a process model in the iGrafix software that accurately reflects the work tasks of a simple sales and marketing organization. - Measure:
We ran transactions through the model to measure the activity levels involved - Analyze:
We translated the activity levels into cost drivers in order to account for where value was being created and where it was begin wasted. This produced financial statements based on the costing and revenue produced to show what the executives in the organization might see. - Improve:
We changed parts of the process to create a higher yield, and ran the transactions through the revised model to produce the new operational and financial results.
Detailed process maps with transaction counts are included in Appendix II – Detailed Information on the Simulation.
No one other than myself is responsible for the accuracy or applicability of the information contained in this whitepaper. If you have any questions or would like to discuss the ideas contained in this paper, please do not hesitate to contact me (contact information is on the last page of this paper).
Appendix II – Detailed Information on the Simulation.
To accommodate those who are analytically inclined, I have included as many details as I could about the process simulation case example.
A full count of the activities and results from the iGrafx simulation software is as follows:
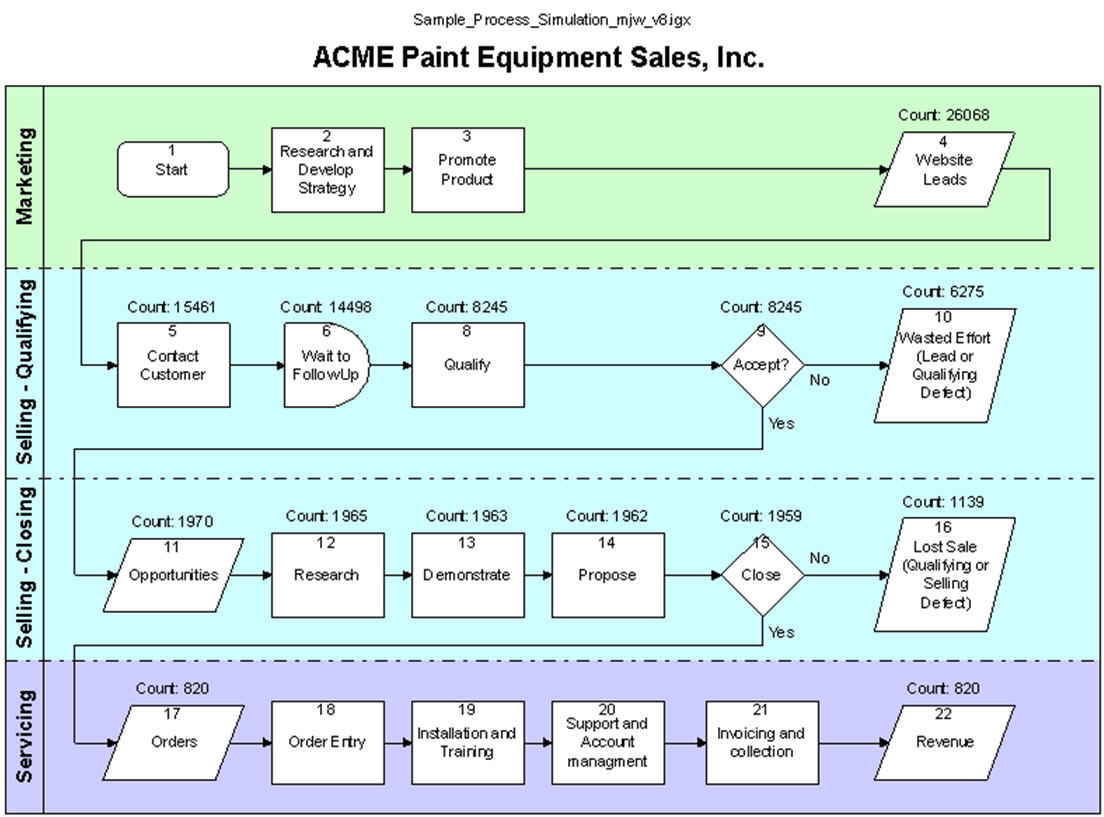
The process maps below were produced for each run of the simulation:
Year 1
Year 2:
Year 3:
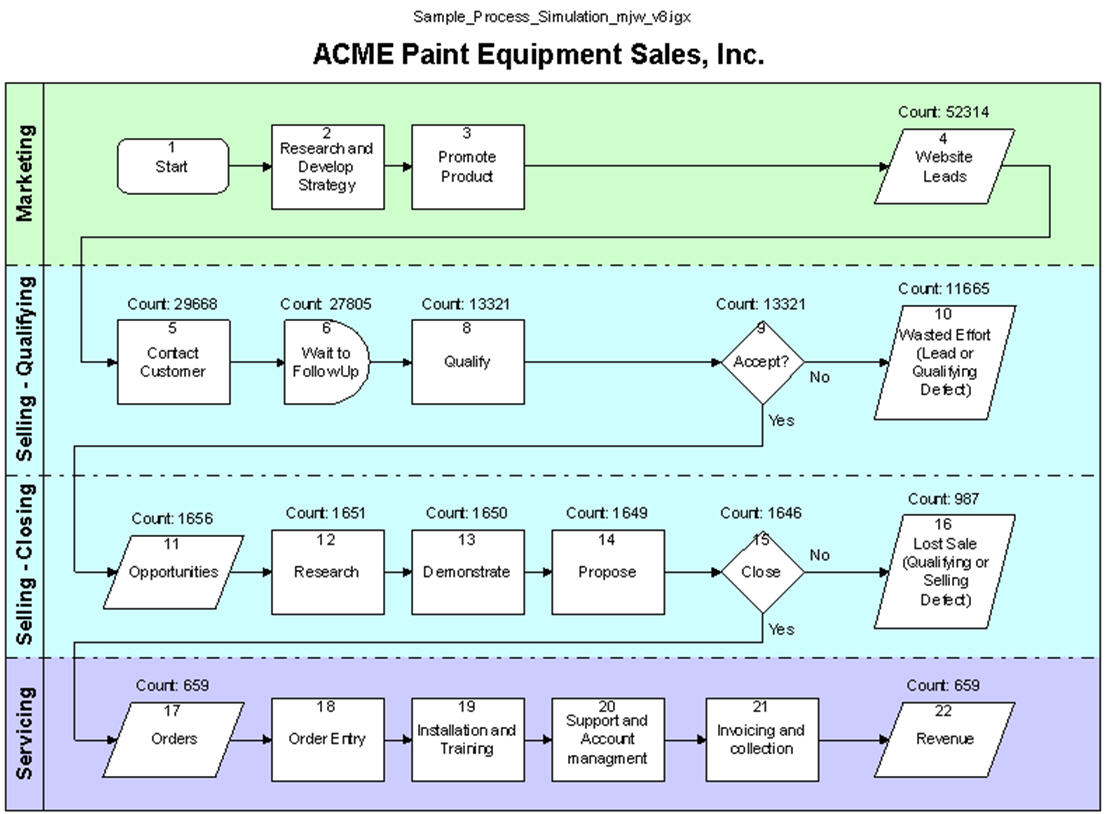
Year 4
The following cost models were produced using ABC Flow charter for Year 1 and Year 4 of the simulation:
Year 1
